
Airbnb Listings EDA Project: New York 2024
Project Overview
This project performs Exploratory Data Analysis (EDA) on New York Airbnb data to uncover trends and patterns in rental listings. We use libraries like Pandas, Numpy, Matplotlib, Seabornfor cleaning, visualization, and analysis.

Objective
The goal of this project is to:
- Analyze room types, prices, and availability across different neighborhoods.
- Understand host behavior and listing patterns.
- Detect potential outliers in prices.
- Provide recommendations for guests and hosts based on insights.
Dataset
The dataset contains 20,765 entries and 22 features, including:
- id: Unique identifier for each listing
- name: Title of the Airbnb listing
- host_name: Name of the host
- neighborhood_group: Group (borough) where the listing is located
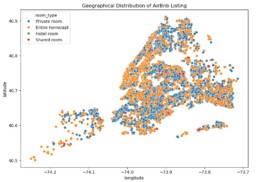
- latitude/longitude: Geolocation of listings
- price: Nightly rental price
- room_type: Type of accommodation (e.g., entire home, private room)
- reviews_per_month: Average monthly reviews for the listing
- availability_365: Number of available days in the year
Steps and Workflow
1. Data Cleaning
- Handle missing data:
price,neighborhood, andbedscolumns had null values. - Fix data types: Converted
last_reviewto a datetime object. - Remove outliers: Listings with prices > $1,000 were capped to avoid skewed visualizations.
2. EDA (Exploratory Data Analysis)
-
Room type distribution:
- Visualized the count of each room type using bar plots.
- Identified Entire home/apt as the most common room type.
-
Neighborhood group insights:
- Analyzed price variations by boroughs.
- Manhattan had the highest average prices.
-
Availability trends:
- Used heatmaps to show correlations among
price,availability_365,number_of_reviews, andbeds.
- Used heatmaps to show correlations among
-
Price distribution:
- Used histograms to show the distribution of prices.
- Majority of the listings were priced between $50 – $300.
-
Host listings:
- Analyzed hosts with multiple listings using boxplots to identify key contributors.
-
Review behavior:
- Used pair plots to show relationships between number of reviews, price, and availability.
3. Data Visualization
- Pairplot: To see correlations among
price,availability, andnumber of reviews. - Heatmap: Showing correlations among numerical features.
- Histograms and Boxplots: To detect outliers in
price. - Bar Charts: Displaying room types and neighborhood group distributions.
Key Findings and Insights
-
Price Trends:
- Manhattan has the most expensive listings, followed by Brooklyn.
- Entire homes/apartments cost significantly more than private or shared rooms.
-
Room Type Distribution:
- Entire homes/apartments are the most common, but private rooms offer budget-friendly options.
-
Outliers in Price:
- Few listings priced at $10,000+ were detected, indicating the need to filter such extreme values.
-
Availability Patterns:
- Listings with high availability tend to have lower prices and more reviews, likely due to better guest experience.
-
Host Behavior:
- Some hosts manage multiple listings, indicating a trend toward professional hosting.
Future Work
- Use machine learning to predict prices based on room type and location.
- Perform sentiment analysis on reviews to better understand guest experiences.
- Create an interactive dashboard using Plotly or Tableau for live monitoring.
Conclusion
This project offers valuable insights into the New York Airbnb market, helping both guests and hosts make informed decisions. By using EDA techniques, we identified key trends and developed actionable recommendations. Future improvements can involve advanced analytics and predictive modeling to further enhance the findings.